
ASSESSMENT OF THE SEASONAL DYNAMICS OF THE NORMALIZED DIFFERENTIAL VEGETATION INDEX (NDVI) AND ITS CORRELATION WITH CLIMATE PREDICTORS IN WETLANDS “LA TEMBLADERA” (ECUADOR)
JOURNAL: «EKOSISTEMY», Issue 26, 2021
Publication text (PDF): Download
UDK: 502.2:[581+551.312.2]:551.583
AUTHOR AND PUBLICATION INFORMATION
AUTHORS:
Llerena S. A., Kurbatova A. I.
Рeoples’ Friendship University of Russia (RUDN University), Moscow, Russian Federation
TYPE: Article
DOI: https://doi.org/10.37279/2414-4738-2021-26-5-11
PAGES: from 5 to 11
STATUS: Published
LANGUAGE: English
KEYWORDS: Wetland, “La Tembladera”, Landsat, NDVI, climate variables.
ABSTRACT (ENGLISH):
Wetlands are considered critical ecosystems due to declining quality of their ecosystems services. Nevertheless, there have not been any climate related researched devoted to vegetation condition and biomass amount. Thus, this study examines the seasonal dynamics of vegetation and its correlations with climatic factors. This study is important for understanding of the regulatory function of this ecosystem during climate change. Two Landsat OLI8 images made in 2020 were analyzed. One image refers to the rainy season (April 12), and the other to the dry season (August 2). The radiometric and atmospheric corrections of the images and the determination of the boundaries of the study site (ROI) were developed in ENVI 5.3 program. The normalized differential vegetation index (NDVI) was calculated with ENVI 5.3 program (histograms allowed to determine biomass), and with ArcGIS 10.3 (for classification index). The Pearson coefficient (r) and the Statistica software were applied to determine the correlations between the variables. The linear relationship between the NDVI, the amount of biomass and the climatic variables was identified. In the rainy season (April) with higher temperature and precipitation, the NDVI was >0.5 and the biomass was 372613.0 t in the major part of “la Tembladera”, while in the dry season (August) with a lower temperature and precipitation rate, both the NDVI (0.14–0.5) and the biomass (333856.95 t) decreased in a considerable area of the wetland. Consequently, the seasonal dynamics of vegetation and its biomass is caused by fluctuations in these climatic variables. Thus, the biomass increased during the rainy season (higher precipitation, temperature, and humidity). These results can be used to further modelling the effects of climate change in these ecosystems.
INTRODUCTION
Worldwide, anthropogenic impacts had triggered environmental problems over natural ecosystems such as wetlands. Wetlands are considered strategic ecosystems, flood absorbers and biodiversity conservation sites, hence, they are crucial ecosystem due to its ecological services (Senhadji-Navarro, Ruiz-Ochoa, Rodríguez-Miranda, 2017). The Wetland «La Tembladera» is one of the two wetlands that the province of El Oro has officially recognized by the Ramsar Convention. The ecosystem services of “la Tembladera” include the water supply for agriculture and livestock, fishing, the climate regulation and the carbon storage(Convención de Ramsar sobre los humedales, 2018). Despite the ecosystem relevance of “La Tembladera”, studies about its current state and its relationship with climate variables is non-existing.
Nowadays, it is possible to use remote sensing to interpret the evolution or dynamics of ecosystems over time and establish relationships with other factors. For instance, remote sensing has allowed the vegetation state assessment and the calculation of biomass (Llerena, Tarko, Kurbatova, Kozhevnikova, 2019; Lv…, 2019). Studies in South America that employed remote sensing analysis to calculate the NDVI and its spatial and temporal dynamics have taken great importance in recent years regarding to the management of the vegetation cover and to the climate modeling (Millano, Paredes, 2016; Paula, Zambrano, Paula, 2018). Nevertheless, studies about wetlands related with remote sensing and NDVI are few in spite of its ecosystem importance (Dong…, 2014; Bisrat, Berhanu, 2018; Aponte-Saravia, Ospina-Noreña, 2019).
Consequently, this study assess the vegetation state, biomass and their relationship with climate parameters of “La Tembladera” wetland through Normalized Differential Vegetation Index (NDVI) by using remote sensing methodology. The objective is to generate information about the behavior of the wetland and its interaction with the climate, which can contribute to studies of vegetation cover and future climate change models. In addition, the applied methodology serves as a framework for future research in relation to the monitoring and study of other ecosystems, favoring all competent entities in matters of conservation, land planning and climate change.
MATERIAL AND METHODOLOGY
Study site. The wetland “La Tembladera” was listed as a Ramsar site in 2011. It is located in the province of El Oro in the southwest of Ecuador (3°29 28.63S 79°59 39.99W; 17 m a.s.l.) in Santa Rosa canton (fig. 1). It is made up of a water mirror (permanently flooded area) and surrounded by an area that is seasonally flooded. The total area is 1471 ha. (López-Blanco, Sinev, 2016; Quevedo, 2013).
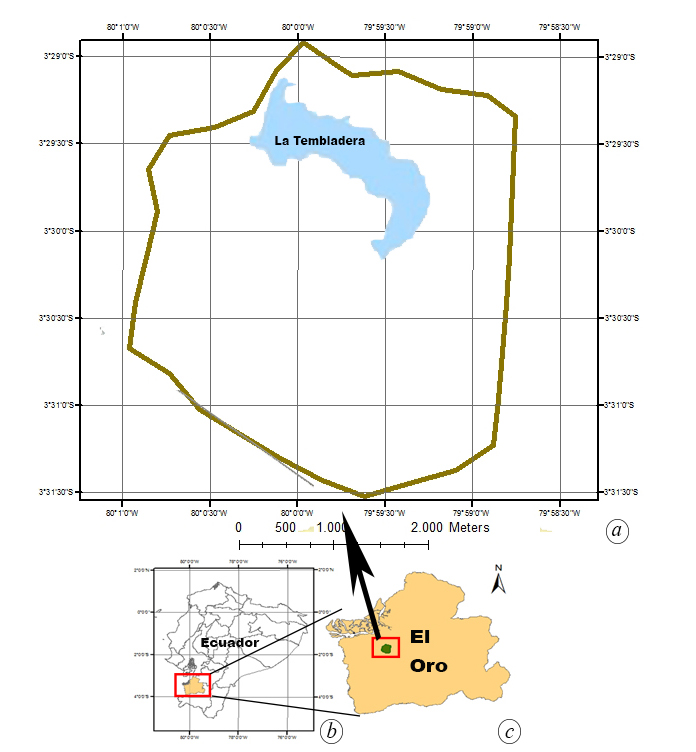
Fig. 1. Location map of “La Tembladera” (a) in Ecuador map (b) and in the Oro province (c)
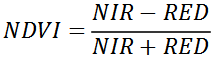
Normalized Differential Vegetation Index. One of the most widely used vegetation index (VI) is the Normalized Difference Vegetation Index (NDVI). It is based on the comparison of visible and near-infrared light reflected from vegetation. Chlorophyll pigments absorb in the red regions of the visible spectrum, called RED zone (wavelength bands between 0,62–0,75 μm.), but not in the green region where the reflectivity is much higher and its maximum value is observed in the near infrared range (NIR, wavelength bands between 0,75–1,3 μm). One advantage of NDVI is that the division by zero errors are significantly reduced, also, it has a desirable measurement scale between -1 to 1, where 0 represents no vegetation, and negative values are non-vegetated surfaces (Pettorelli, 2013). The formula of the NDVI is:
Two Landsat images, corresponding to August 2nd and April 12th of 2020, that encompass the study area of La Tembladera wetland were downloaded from Earth Explorer of the United States Geological Survey (USGS). The scenes are located in the grid of the World Reference System 2 (WRS2) in the column 11 raw 62.
The processing of Landsat images, radiometric calibration and atmospheric correction, was developed in ENVI 5.3 program. In this program the multispectral file (MTL) was used as initial data, the area of interest (ROI) was specified in the scenes. The atmospheric correction was developed with FLAASH Atmospheric Correction Model of the program. The resulting images (fig. 2) were used to calculate NDVI and its histograms with the tool NDVI of ENVI. Then the biomass was estimated with the data of pixel and NDVI scale from the histograms (fig. 3) (Llerena…, 2019).
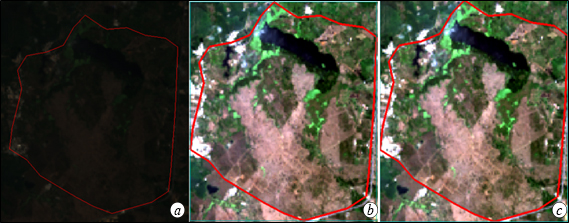
Fig. 2. Processing result of the Landsat image in the ENVI 5.3.
Original Landsat image (a). Result image of radiometric calibration (b). Result image of atmospheric correction (c). Differences between (b) and (c) are on pixels level.
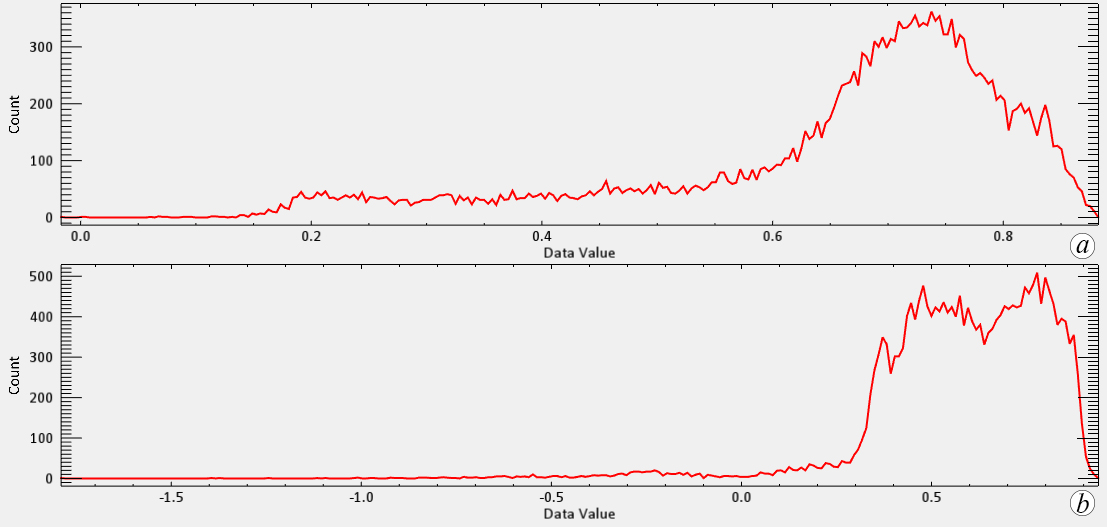
Fig. 3. Histogram of the Landsat images, the pixels are shown on the ordinate axis and the NDVI range on the abscissa axis
Histogram for NDVI in April 12th, 2020 (a). Histogram for NDVI in august 2nd, 2020 (b).
In ArcGIS 10.3 program, the two resulting images were classified in 6 vegetation intervals (Kafria, Albanakis, Oikonomidis, 2014) (table 1) in order to create the NDVI map.
Table 1
Intervals of NDVI scale from –1 to +1
| Interval | Type of land cover |
| 0,04 | Water |
| 0,04–0,025 | Wetland |
| 0,025–0,09 | Bare ground (degraded land, roads, settlements, soil without vegetation cover) |
| 0,09–0,14 | Scarce Vegetation (scattered shrub, irrigated crops and plow fields) |
| 0,14–0,5 | Medium Vegetation (forest plantations, bushes, slow-growing plantations) |
| >0,5 | Thick Vegetation (dense growth plants) |
Vegetation biomass and climate variables correlation. The climate parameters selected for April and August were (table 2): temperature, percentage of cloudiness probability, percentage of precipitation probability, precipitation in mm, percentage of humidity probability, wind speed, water temperature, and solar energy (Kwh) (Cedar Lake Ventures, 2020)
Table 2
Climate factors at Santa Rosa canton for April and August of 2020
| Factors | 12.04.2020 | 02.08.2020 |
| Maximum temperature (°C) | 32 | 29 |
| Minimum temperature (°C) | 25 | 22 |
| Percentage of cloudiness probability | 27 | 72 |
| Percentage of precipitation probability | 35 | 1 |
| Precipitation (mm) | 66 | 2 |
| Percentage of humidity Probability | 99 | 62 |
| Wind speed (km/h) | 8 | 8.2 |
| Water temperature (°C) | 26 | 23 |
| Solar energy (Kwh) | 5.4 | 6.3 |
By using the software Statistica the correlations between the factors of climate and the biomass amount were determined.
RESULTS AND DISCUSSION
There are differences between the seasonal NDVI of “La Tembladera”. In April, which represents the rainy season, most of the wetland territory is classified as thick vegetation (NDVI >0,5, fig. 4a.). In addition, little areas within the wetland territory are medium vegetation, (NDVI: 0,14–0,5). In contrast, for dry season (august, fig. 4b.) the medium vegetation replaces the majority of thick vegetation. Furthermore, in the lagoon area the NDVI decreases and corresponds to wetland and water cover (NDVI: –0,04–0,025 and <–0,04, respectively).
The NDVI differences was also corroborated with the biomass calculation based on the NDVI histograms. The biomass was 372613.0 t for April and 333856.95 for August. In conclusion, the biomass decreased between rainy and dry season.
The correlation coefficient between the biomass and all the climate variables is showed in the figure 4. The temperature, percentage of precipitation probability, precipitation, percentage of humidity probability and the water temperature have a direct correlation (r=1; p<0.5). It means that when these climate variables increases, the biomass also increases. In contrast, the biomass showed an indirect correlation with the percentage of cloudiness probability, the wind speed and the solar energy. To conclude, the results show that the photosynthetic activity responds to the water availability (precipitation and humidity), thus, in April the vegetation index is better than in August.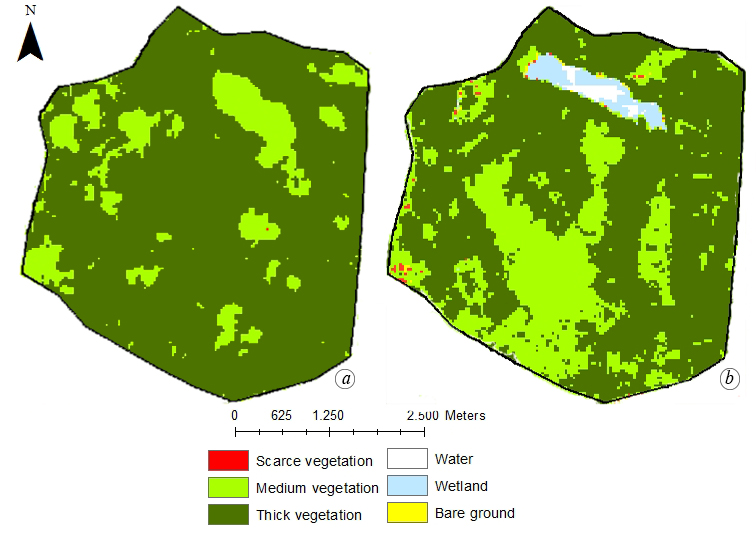
Fig. 4. La Tembladera wetland Normalized Differential Vegetation Index map for April 2020 (a) and August 2020 (b). (ArcGIS 10.3.)
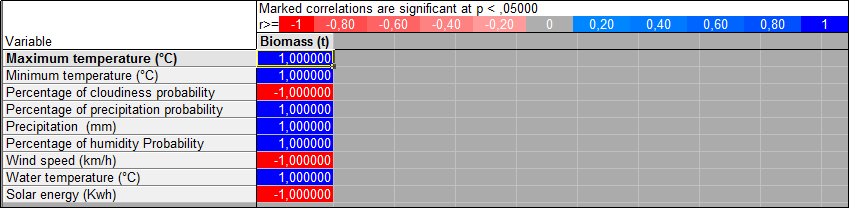
Fig. 5. Pearson correlation coefficient (r) between Biomass and all the climate factors.
Statistica 10.0 software
The results of the research “Evaluating the performance of spectral indexes for identify high Andean wetland” showed a lower vegetation index in the dry season as in this study. Aponte and Ospina attributed the results to hydric stress(Aponte-Saravia, Ospina-Noreña, 2019). The correlation between NDVI, wetland area, precipitation and temperature was established in an Andean wetland. Similar findings were discovered with a significant direct correlation (Garcia, Otto, 2015; Pauca-Tanco…, 2020).
CONCLUSION
From the present investigation, a positive correlation between the NDVI, the amount of biomass and the climatic variable was established, according to the Pearson coefficient (r=1). Thus, we found a relationship directly proportional. Furthermore, we found that the vegetation state and biomass of “La Tembladera” depend of precipitation, humidity and local temperature. In the rainy season (high temperature and precipitation rate), the majority area of “La Tembladera” was classified as thick vegetation (NDVI>0.5) and the biomass was 372613.0 t, while in dry season (low temperature and precipitation rate) in a considerable area of the wetland the index was medium vegetation (NDVI: 0.14–0.5) and the biomass decrease until 333856.95. In conclusion, a vigorous vegetation will be found in the rainy season. These results are aligned to the RAMSAR (Convention on Wetlands of International Importance) aims because they can contribute to studies of vegetation cover and future climate change models.
Finally, remote sensing and vegetation index analysis, such as NDVI, are key tools for monitoring and evaluating the status of wetlands under the current pressures of climate change. This methodology is effective and fast due to the fact that the satellite images are freely accessible. Also, the applied methodology could be used in different ecosystems of the country to contribute to future studies of conservation and monitoring.
Acknowledgments. The publication has been supported by the RUDN University Strategic Academic Leadership Program.
REFERENCES
Aponte-Saravia J., Ospina – Noreña, J. E. Evaluando el desempeño de índices espectrales para identificar humedales alto andinos // Revista de Teledetección. – 2019. – N 53. – P. 59.
Bisrat E., Berhanu B. Identification of Surface Water Storing Sites Using Topographic Wetness Index (TWI) and Normalized Difference Vegetation Index (NDVI) Article history // Journal of Natural Resources and Development. – 2018. – Vol. 8 – P. 91–100.
Cedar Lake Ventures [Electronic resource]. – Weather Spark.com. – 2020. – Retrieved from: https://es.weatherspark.com/m/19333/8/Tiempo-promedio-en-agosto-en-Santa-Rosa-Ecuador (Reviewed 15.01.2020).
Convención de Ramsar sobre los humedales. Perspectiva mundial sobre los humedales: Estado de los humedales del mundo y sus servicios a las personas. – Editorial: Secretaría de la Convención de Ramsar, 2013. – P. 1–88.
Dong Z., Wang Z., Liu D., Song K., Li L., Jia M., Ding Z. Mapping Wetland Areas Using Landsat-Derived NDVI and LSWI: A Case Study of West Songnen Plain, Northeast China // Journal of the Indian Society of Remote Sensing. – 2014. – Vol. 42, N 3. – P. 569–576.
Garcia E., Otto M. Caracterización Ecohidrológica De Humedales Alto Andinos Usando Imágenes De Satélite Multitemporales en La Cabecera De Cuenca Del Río Santa, Ancash, Perú // Ecología Aplicada. – 2015. – Vol. 14, N 1. – P. 115.
Kafria V., Albanakis K., Oikonomidis D. Flood Susceptibility Assessment using G . I . S . An example from Kassandra // Proceedings of the 10th International Congress of the Hellenic Geographical Society. – 2014. – P. 287–308.
Llerena S., Tako A., Kurbatova A., Kozhevnikova P. Assessment of carbon dynamics in Ecuadorian forests through the Mathematical Spatial Model of Global Carbon Cycle and the Normalized Differential Vegetation Index (NDVI) // E3S Web of Conferences. – 2019. – Vol. 96. – P. 7.
López – Blanco C., Sinev A. Y. Cladocera biodiversity in la Tembladera Lake (Ecuador): A palaeolimnological approach // Crustaceana. – 2016. – Vol. 89, N 14. – P. 1611–1637.
Lv J., Jiang W., Wang W., Wu Z., Liu Y., Wang X., Li Z. Wetland loss identification and evaluation based on landscape and remote sensing indices in Xiong’an new area // Remote Sensing. – 2019. – Vol. 11, N 23. – P. 1–21.
Millano J., Paredes F. Variabilidad de la Vegetación con el Índice de Diferencia Normalizada (NDVI) en Latinoamérica // Novum Science. – 2016. – Vol. 2, N 4. – P. 33–44.
Pauca – Tanco A., Ramos – Mamani C., Luque – Fernández C. R., Talavera – Delgado C., Villasante – Benavides, J. F., Quispe – Turpo, J. P., Villegas – Paredes, L. Análisis espacio temporal y climático del humedal altoandino de Chalhuanca (Perú) durante el periodo 1986-2016 // Revista Teledetección. – 2020. – N 55. – P. 105.
Paula P. A., Zambrano L., Paula P. Análisis Multitemporal de los cambios de la vegetación, en la Reserva de Producción de Fauna Chimborazo como consecuencia del cambio climático // Enfoque UTE. – 2018. – Vol. 9, N 2. – P. 125–137.
Pettorelli N. The Normalized Difference Vegetation Index. – Publisher: Oxford University Press, 2013. – P. 224.
Quevedo O. Evaluación y propuesta de modelo de gestión en los humedales Ramsar, aplicado en el subsistema marino costero de Ecuador // Revista Non Verba. – 2013. –Vol. 2. – P. 20.
Senhadji – Navarro K., Ruiz – Ochoa M. A., Rodríguez – Miranda J. P. Estado ecológico de algunos humedales colombianos en los últimos 15 años: Una evaluación prospectiva // Colombia Forestal. – 2017. – Vol. 20, N 2. – P. 181–191.